
Meet Pointelist. A high density sensor network that you configure to collect data on spaces and places.
Features
Pointelist is different than existing sensor technology in several ways:
Comprehensive
A complete sensor network that provides both hardware and an online interface
High Density
Sensors can be clustered to achieve highly granular data sets
Low Cost
Pointelist is a fraction of the cost per data point when compared to other technologies
Flexible
Replace a single sensor without disrupting the whole network
Quick, Clear Results
Online interface allows raw data to be viewed, organized, and graphed
Accessible
A mobile-ready interface allows access and data management anytime, anywhere
Customizable
Fully-documented API permits custom data application development
Field Tested
Successfully deployed in numerous academic and professional experiments
Use Cases
Pointelist was developed to support a range of data-driven design approaches, and has been used to measure:
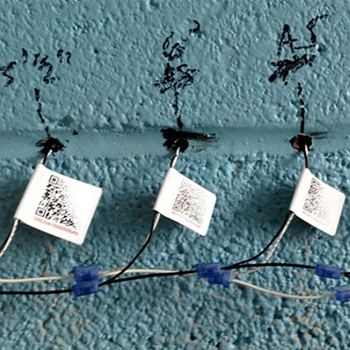
Baseline Energy Performance
An unoccupied building required an accurate baseline for energy performance. Designers heated the building with portable heaters and tracked the rate of thermal decay while using 65 Pointelist sensors embedded at various depths in an existing wall to understand how quickly heat was lost through the envelope.

Daily Interior Temperatures
A typical building management system provides only two temperature data points for the main floor space, which is insufficient to reflect the thermal comfort of over 100 employees. By embedding an additional 300 Pointelist sensors at a variety of locations, building managers were able to precisely manage building conditioning to deliver a comfortable work environment.
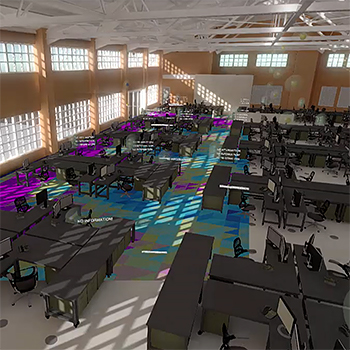
Immersive Environments
Larger, denser sensor networks often aren’t compatible with traditional data interpretation methods such as graphs. Pointelist’s fully-documented API allows users to leverage newer and better tools for data visualization. One successful application involved data from Pointelist being dynamically loaded into Unity, a 3D gaming engine, as part of an immersive environment.
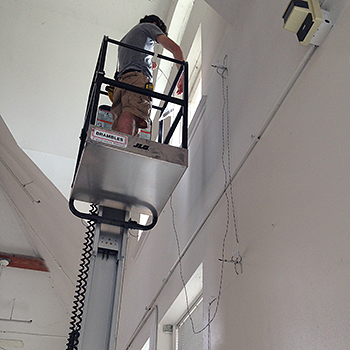
Human Thermal Comfort
One of the most important factors of human thermal comfort is mean radiant temperature (MRT) or the thermal exchange of room occupants with the building surfaces that surround them. A design team arrayed 150 Pointelist temperature sensors on the interior surfaces of select rooms to calculate the MRT for any location in the sensor deployment area.
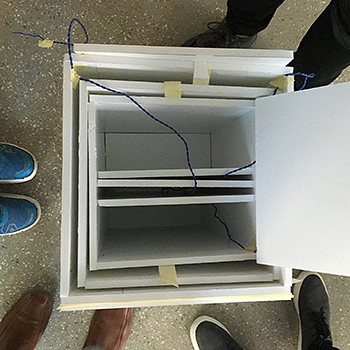
Thermodynamic Systems
Architecture students designed forms as adjustable, thermodynamic systems to meet daily goals. Using Pointelist’s real-time graphed data to provide quick, essential feedback, students relied on temperature readings in five-minute intervals to determine whether they should rapidly add or remove layers, or entirely reform layers and volumes to work towards other goals.
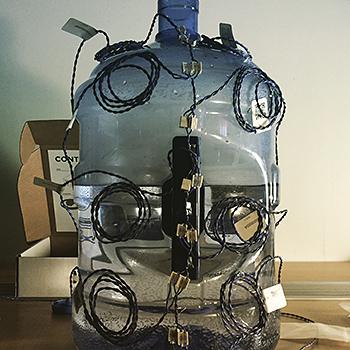
Liquid Volume
Hackathon participants found that measuring the temperature differential between filled and empty portions of a container was an accurate method for calculating volume. The Pointelist API streamlined the data that was pulled into a visualization tool, creating a focus on data representation and analysis instead of the mechanics of data collection, telemetry, and storage.

Support
A complete set of installation and account instructions is available below. For a list of troubleshooting tips, see our Frequently Asked Questions. For all other questions, contact us.
Download Instructions